Dashboard
The Dashboard is the main view of the app. It shows the current status of the leak detector and allows you to control the most important functions of the leak detector.
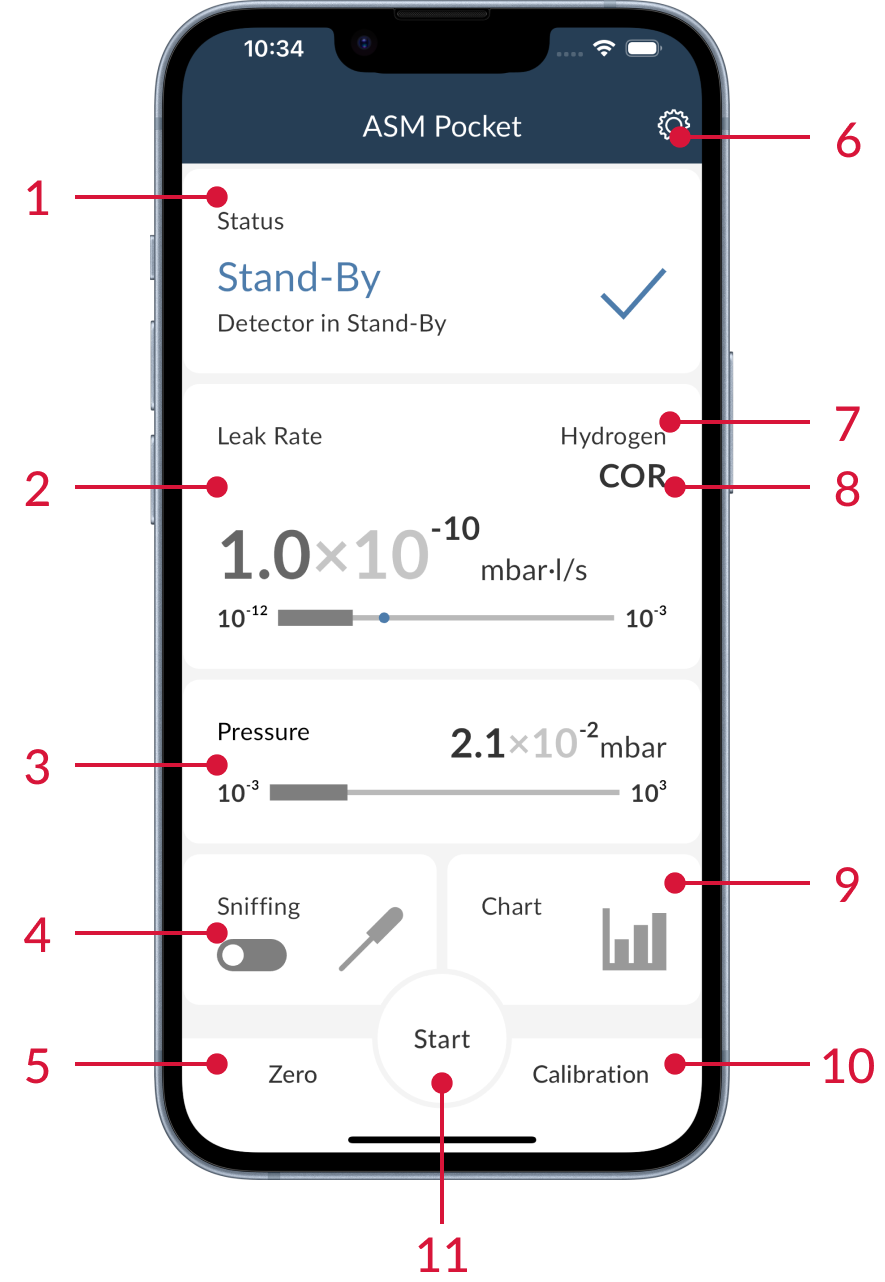
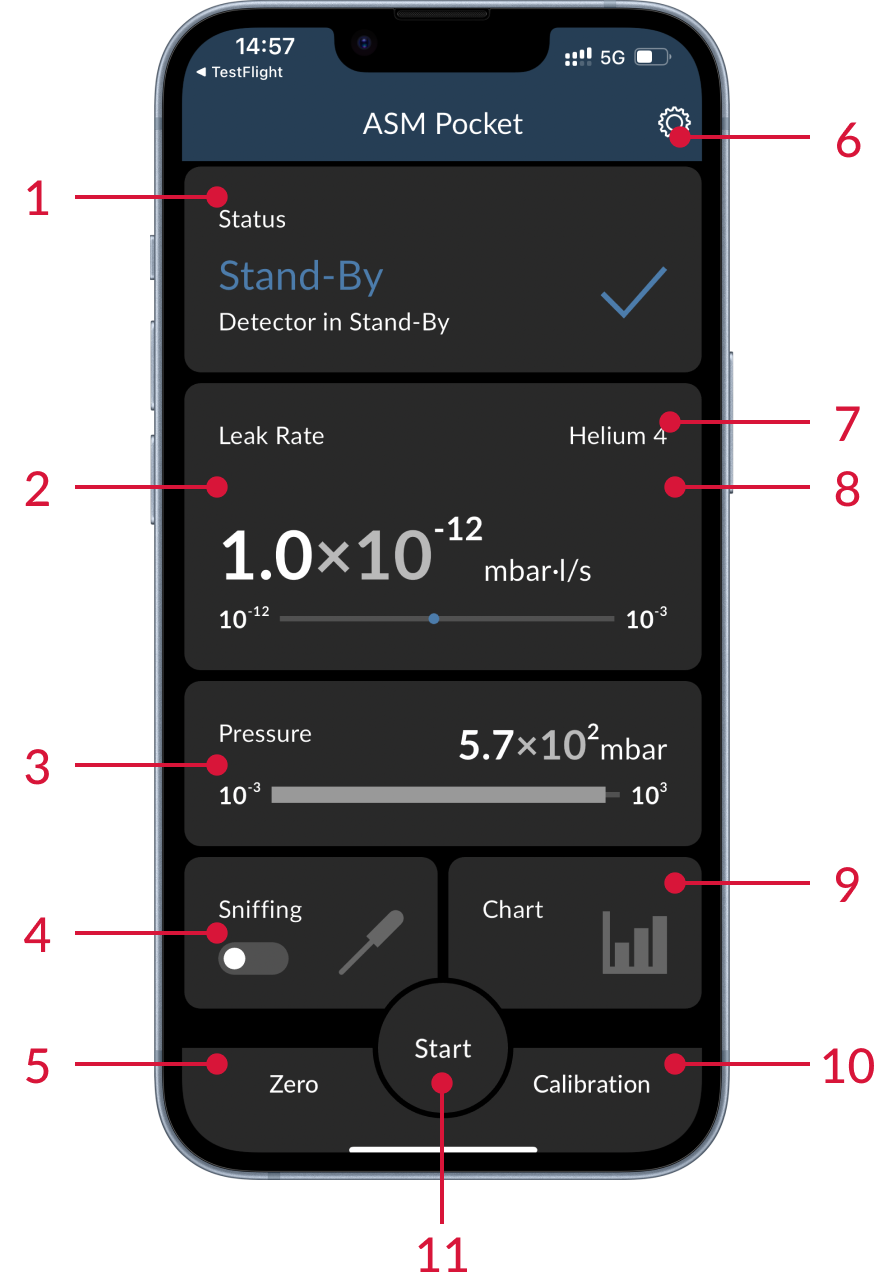
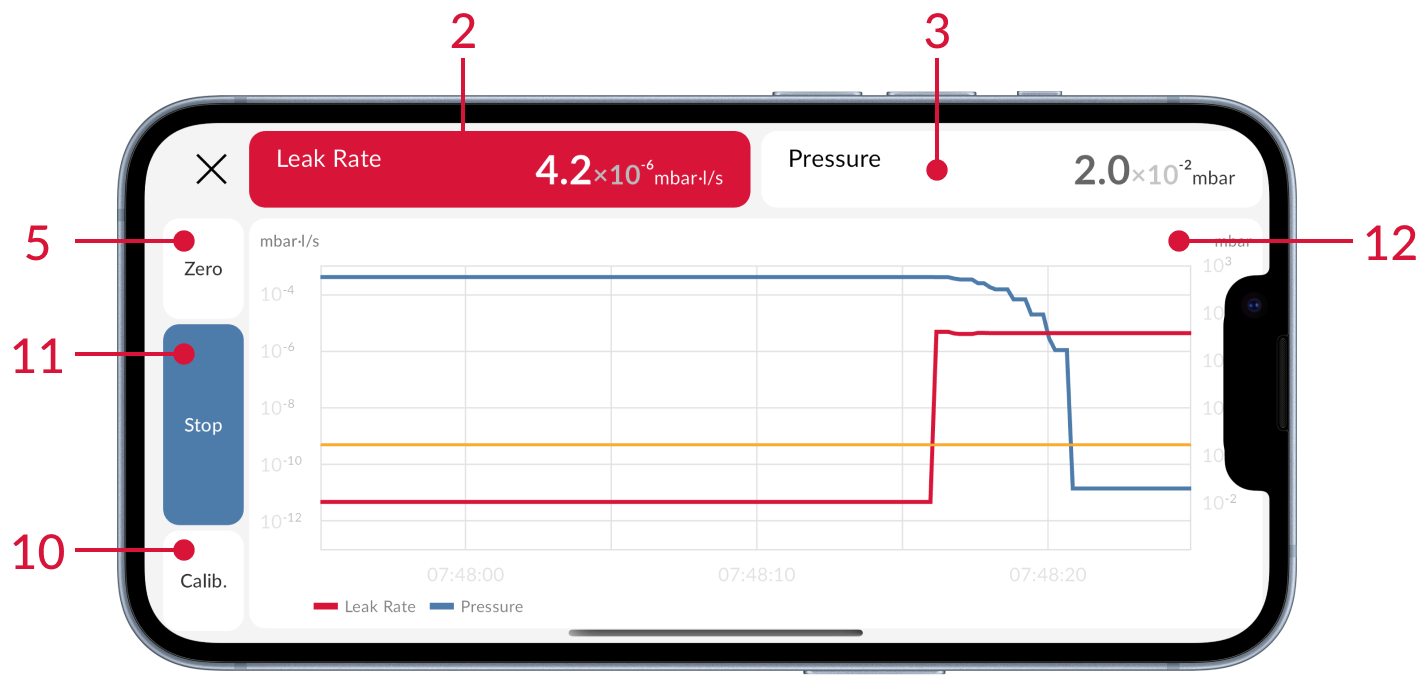
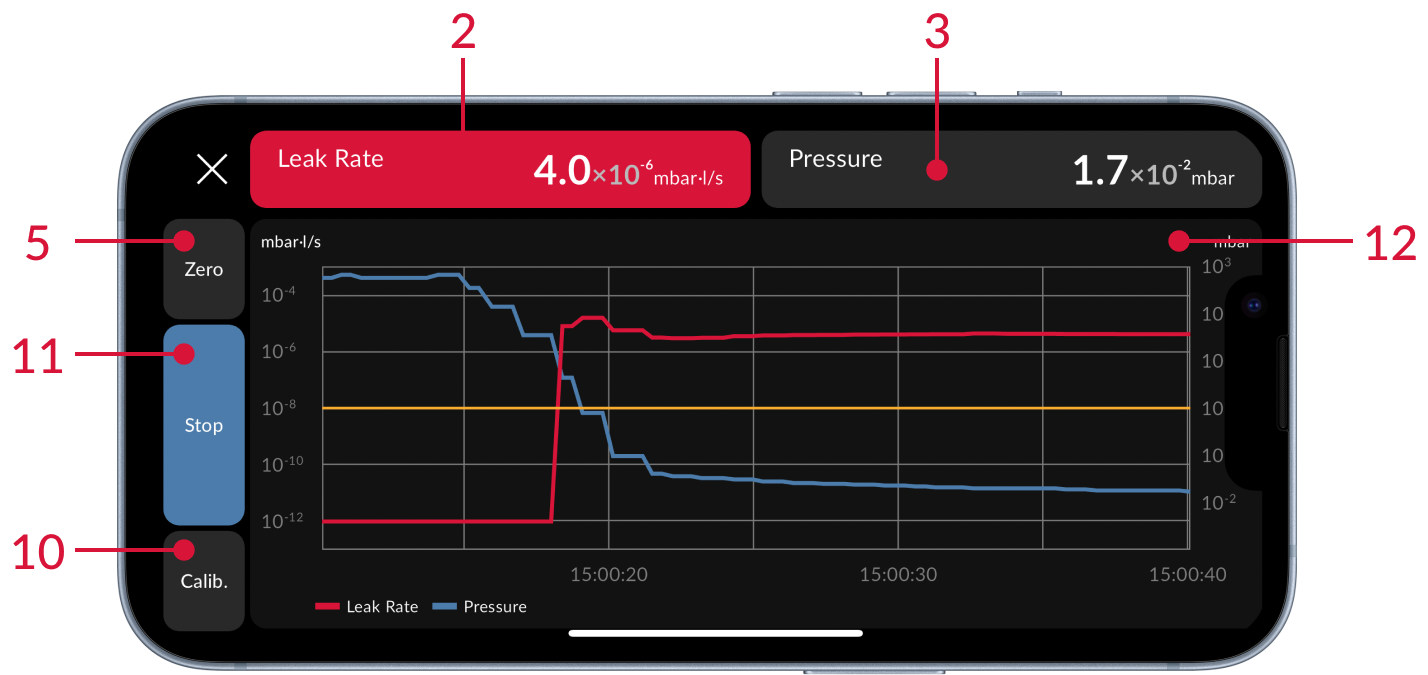
| No. | Function | Description |
|---|---|---|
| 1 | Status Card | Shows the current status of the leak detector. Warnings are displayed with a yellow background color. Errors show a red background color. |
| 2 | Leak Rate Card | Shows the current leak rate value as number and progress bar. The blue circle on the progress bar shows the leak rate threshold. During an active measurement the card's background color displays if the threshold is crossed (red) or not (green). The leak rate unit is defined by the connected leak detector. |
| 3 | Pressure Card | Shows the current pressure value as number and progress bar. The pressure unit is defined by the connected leak detector. |
| 4 | Sniffing Switch | Enables or disables the sniffing mode. The sniffing mode is described in the Sniffing section. |
| 5 | Zero | Enables the Zero function. The Zero function is described in the Zero section. |
| 6 | Settings | Opens the Settings view. |
| 7 | Tracer Gas | Displays the current tracer gas. |
| 8 | Corrected Leak Rate | Indicator if the leak rate is virtually corrected or not. |
| 9 | Chart Button | Opens the Chart view. |
| 10 | Calibration | Activates the internal leak detector calibration. |
| 11 | Start/Stop | Start/Stop a leak detection. |
| 12 | Chart | Real time data in a line chart. |