Chart
The chart view allows you to display the values of leak rate and pressure over the last 30s in a live trend chart. To open the chart view, press the Chart card on the dashboard.
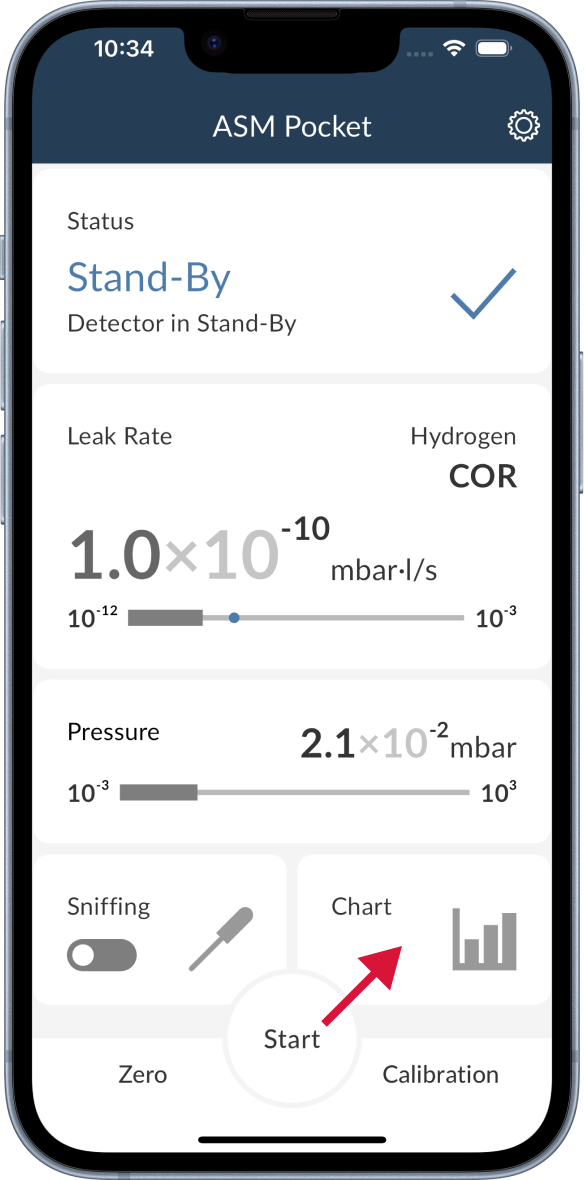
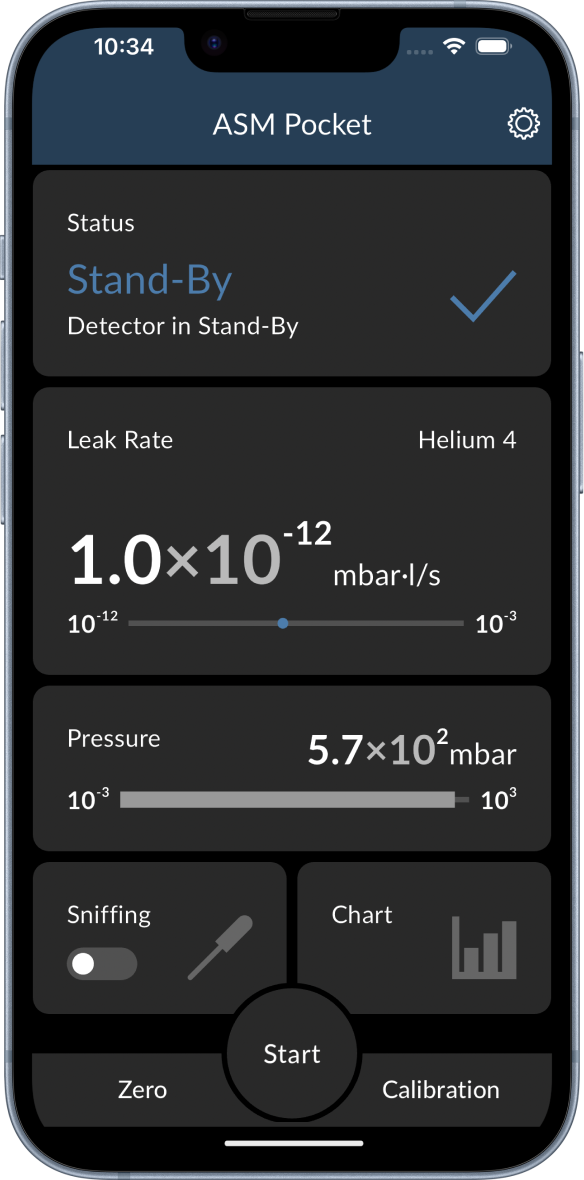
The display will be rotated automatically to use the space optimally.
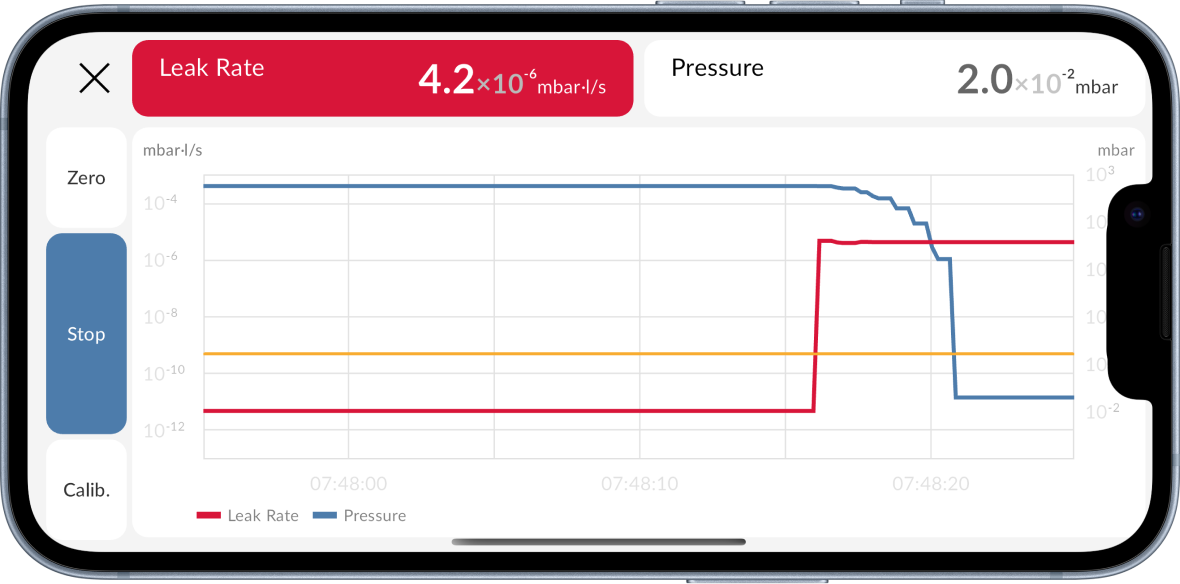
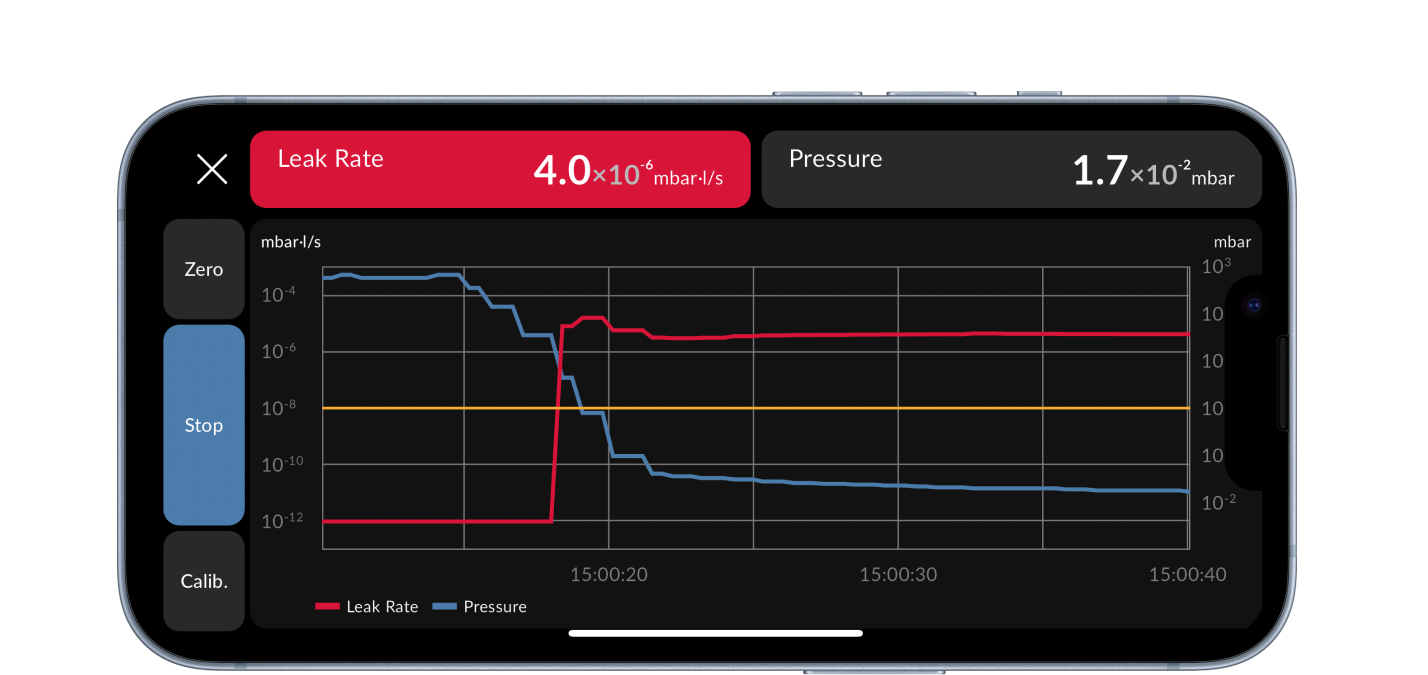
- In the chart view you are able to control the basic functions of the leak detector. The controls (zero, start/stop, calibration) can be found on the left side of the chart view.
- At the top of the chart view you can find the current leak rate and pressure. As in the dashboard view the leak rate card displays if the leak rate is in the tolerance range or not by the corresponding background colors.
- To leave the chart view simply press the X icon in the top left corner.
- The graphs line colors can be individually changed in the settings menu. For further information check the settings section.